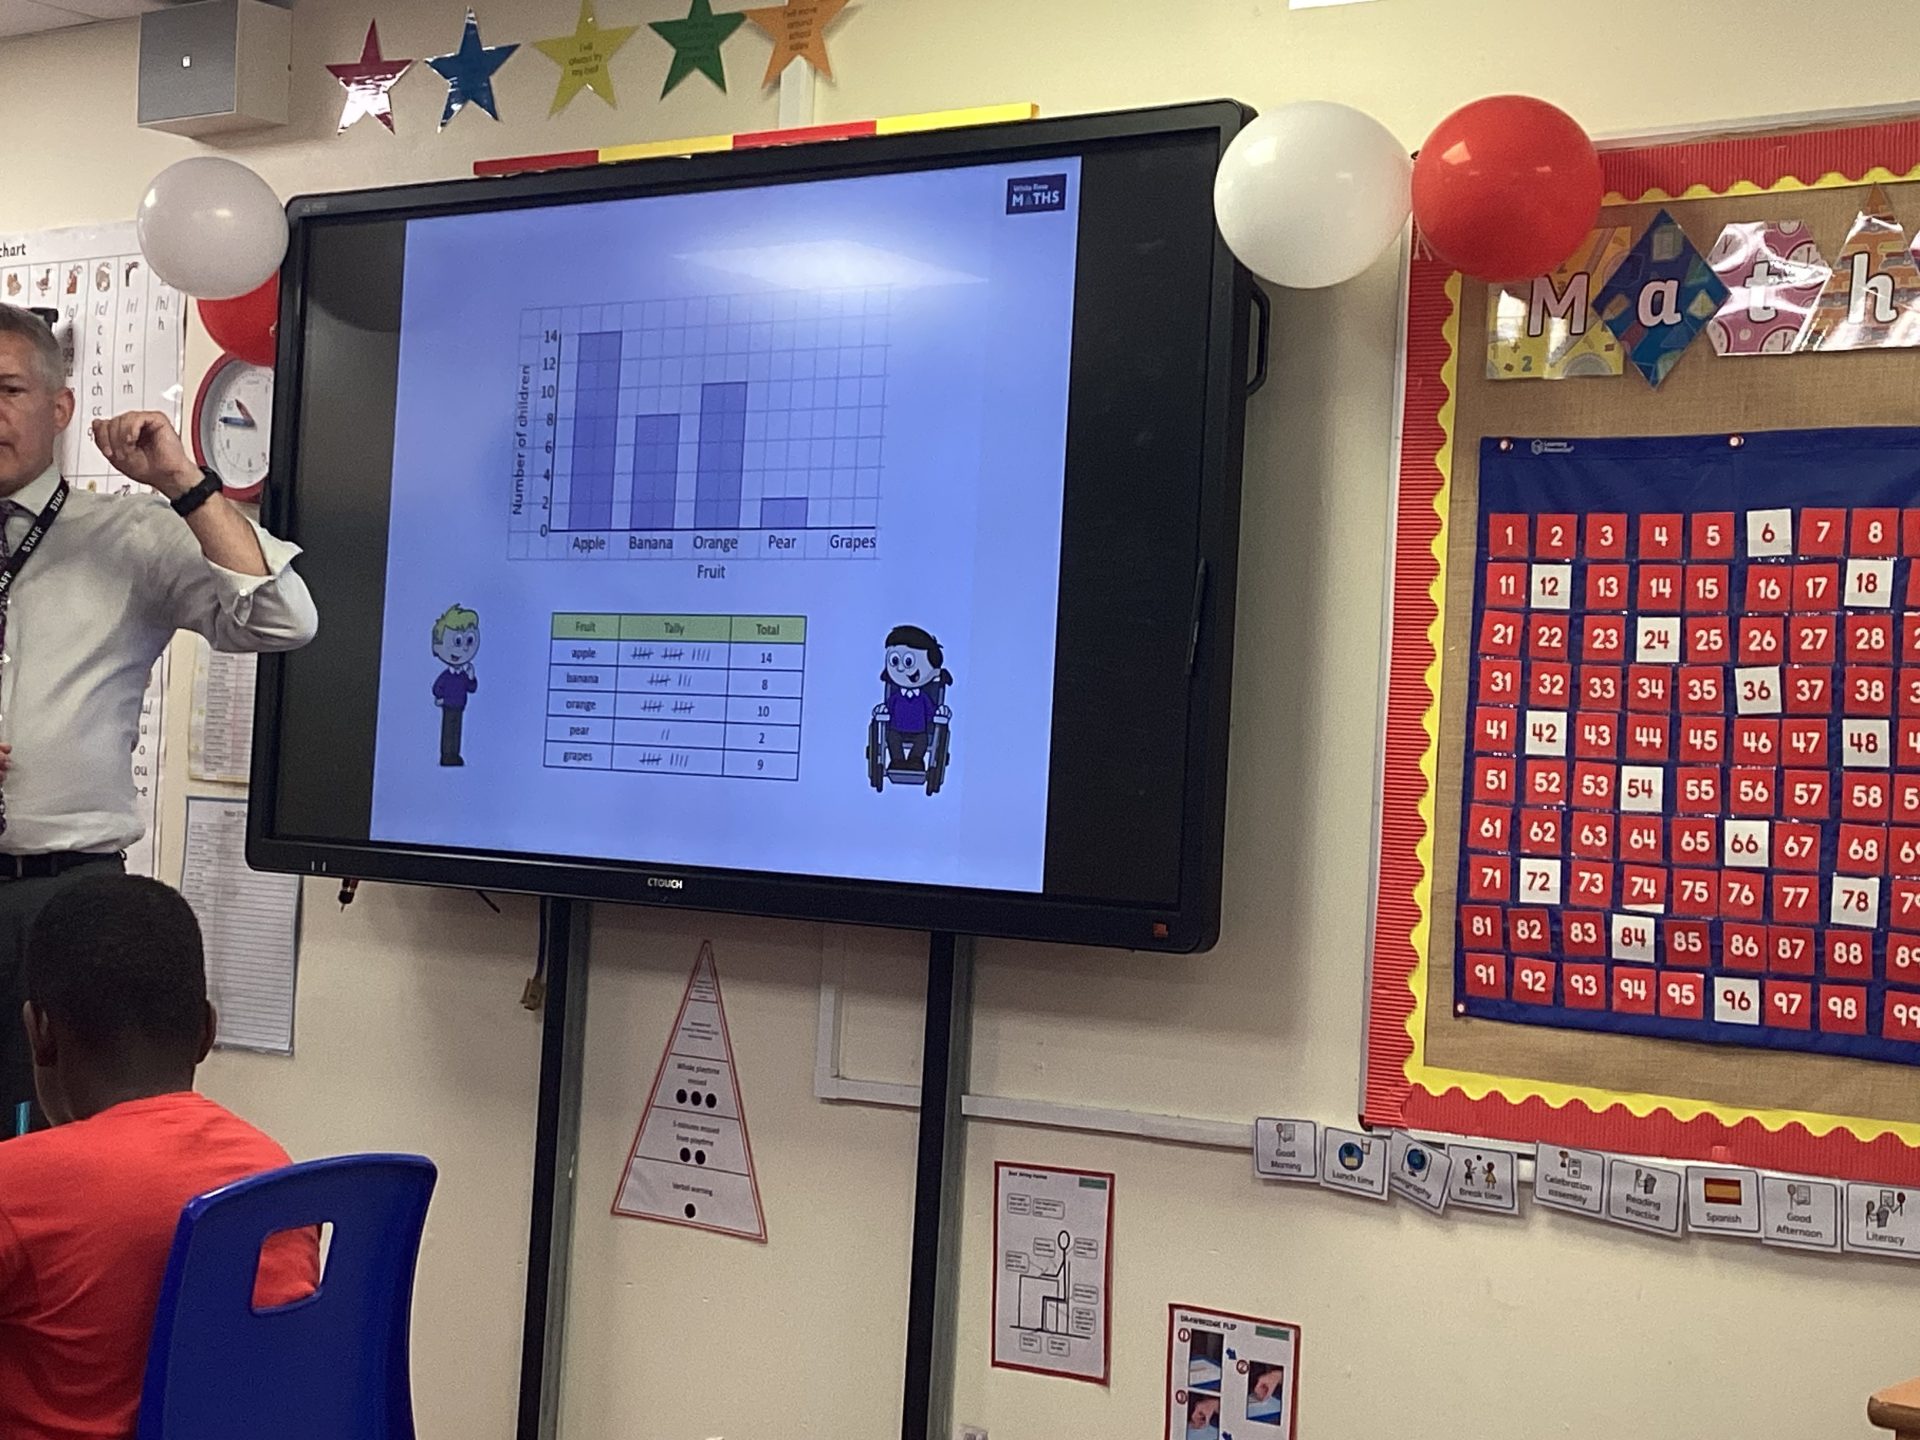
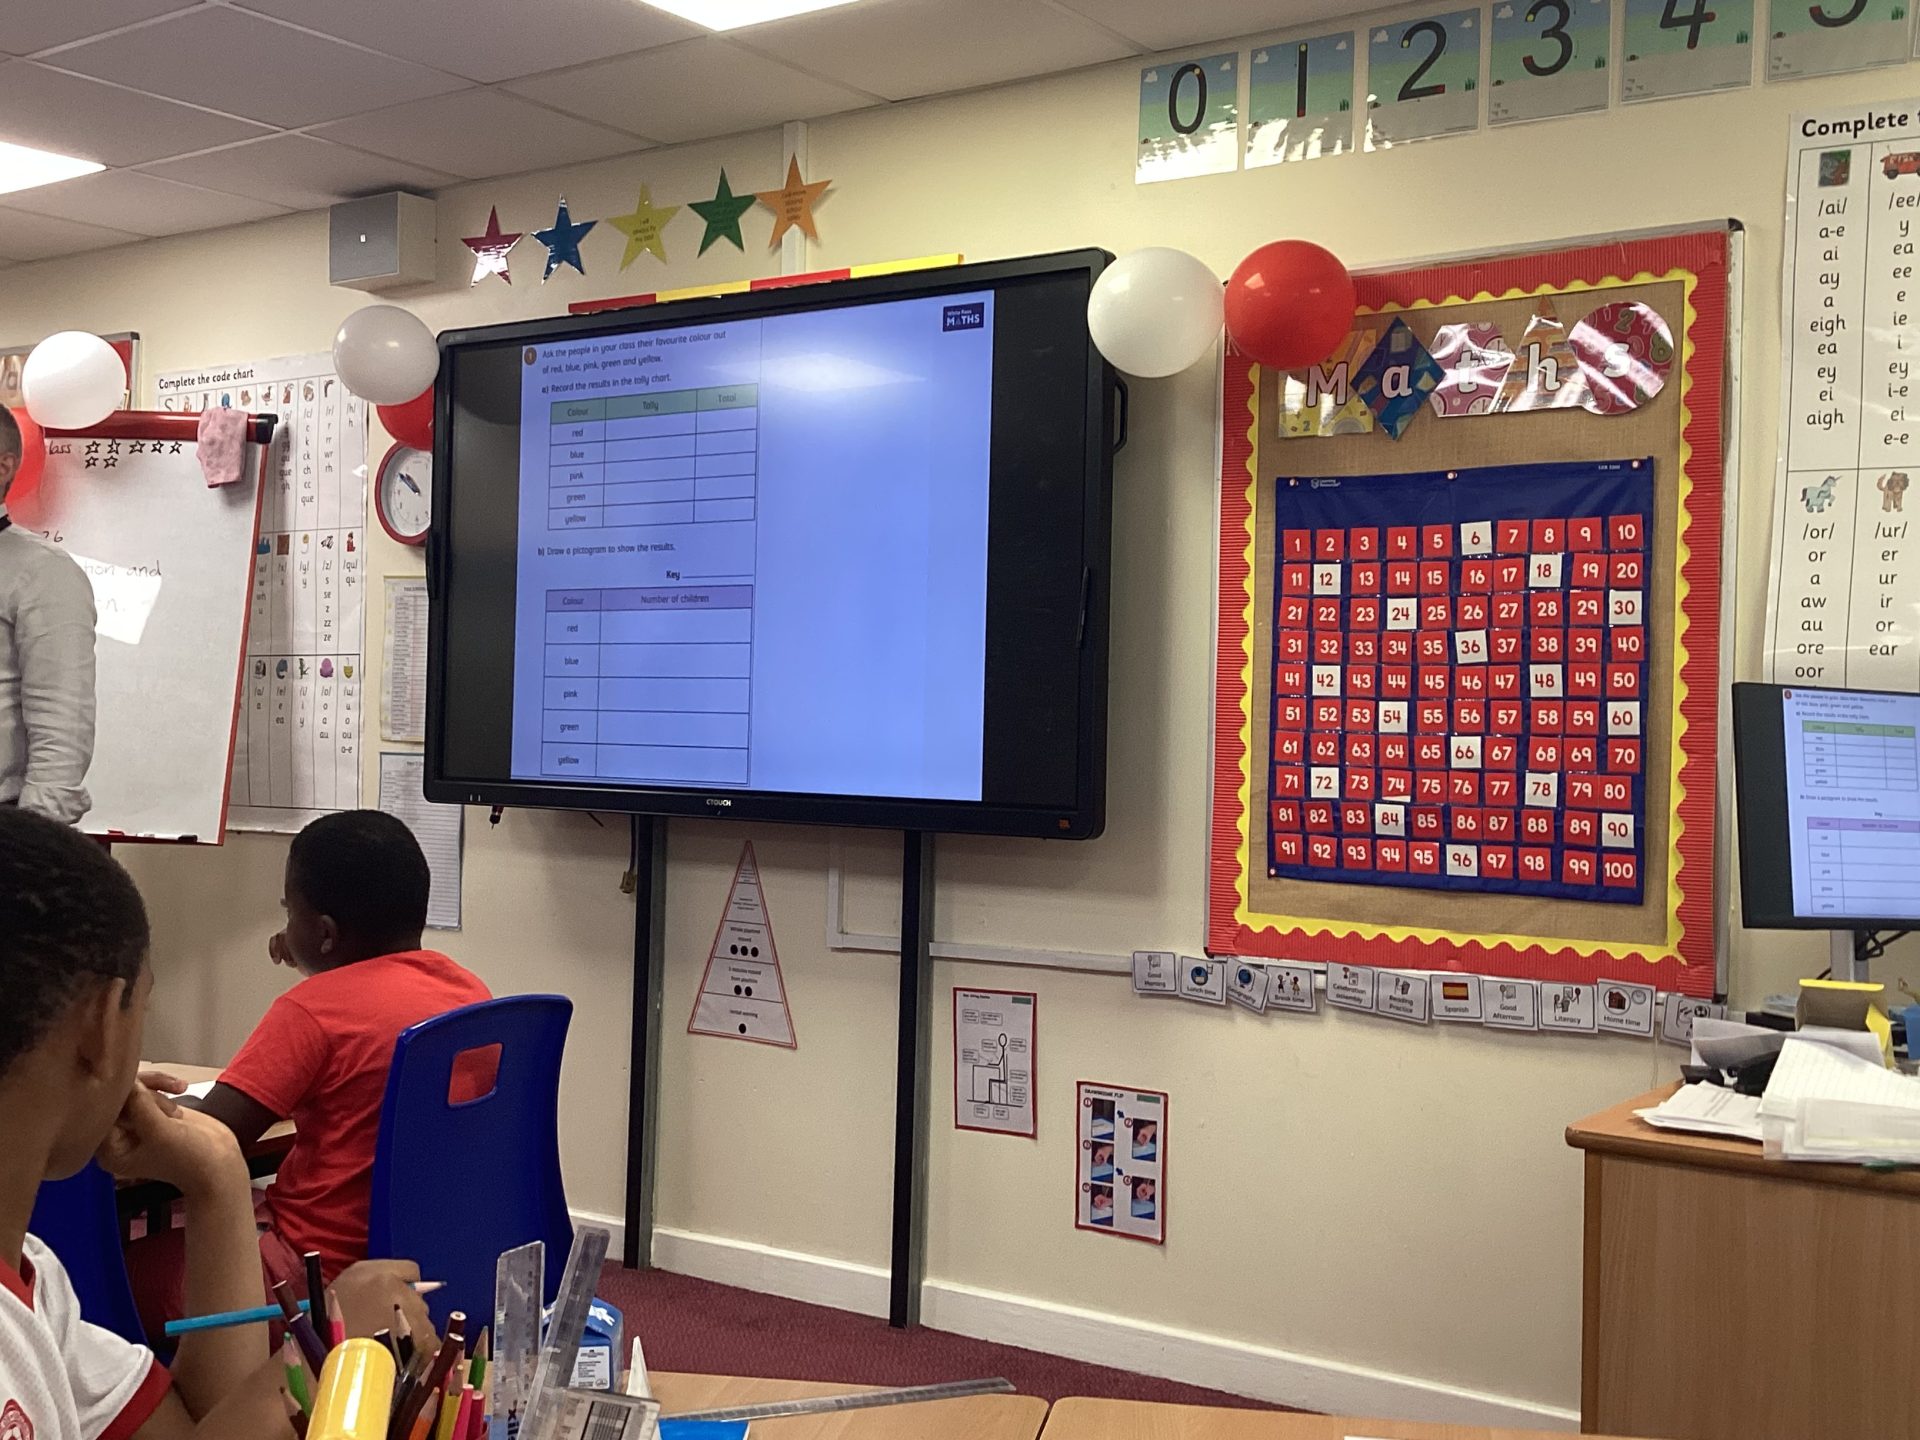
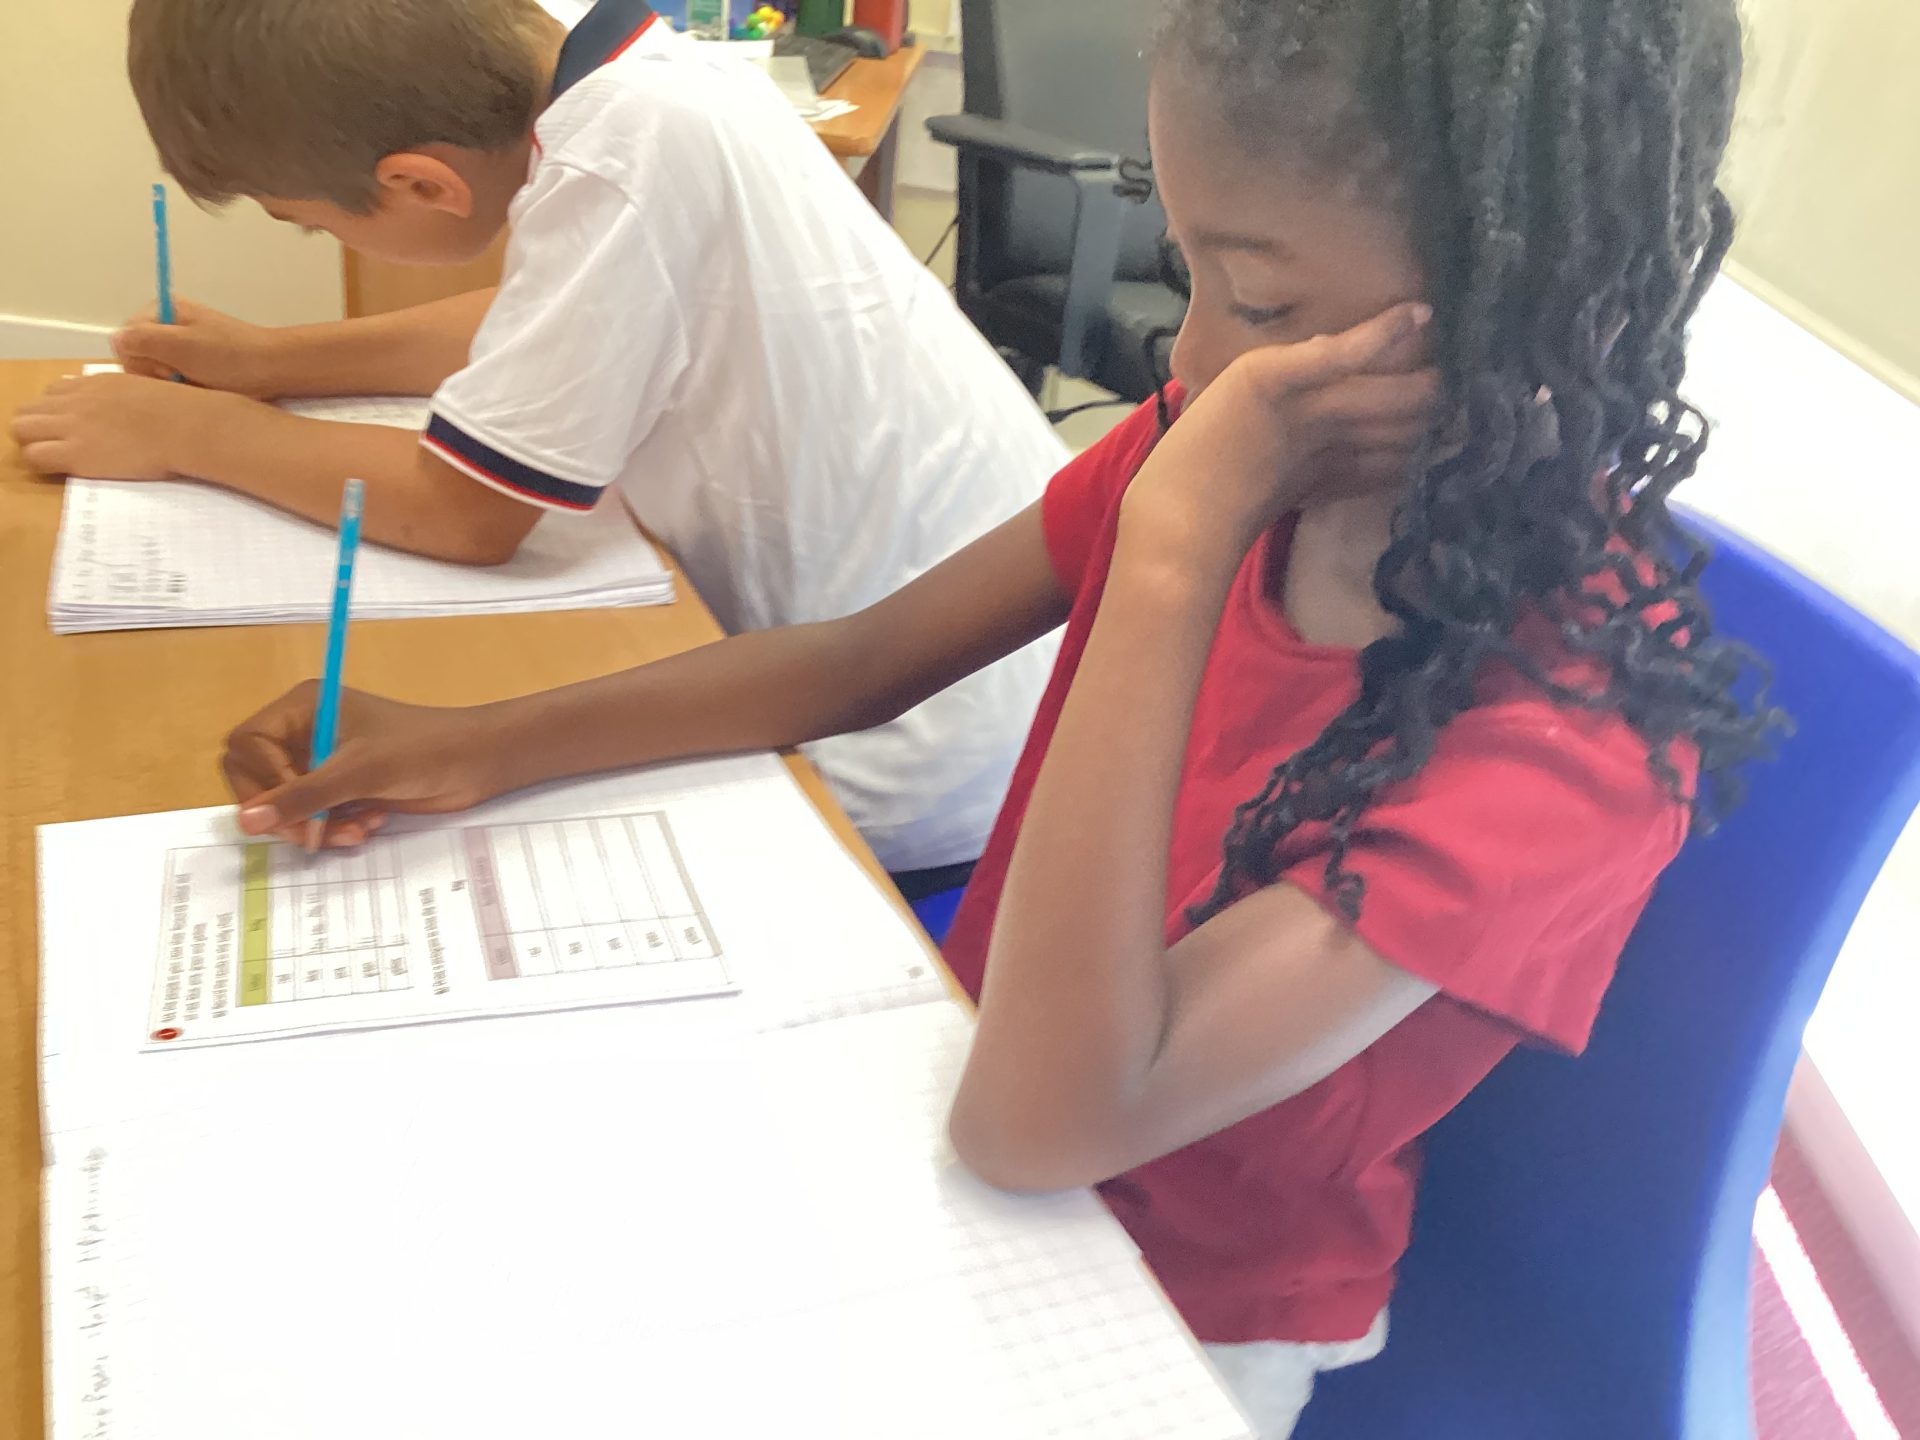
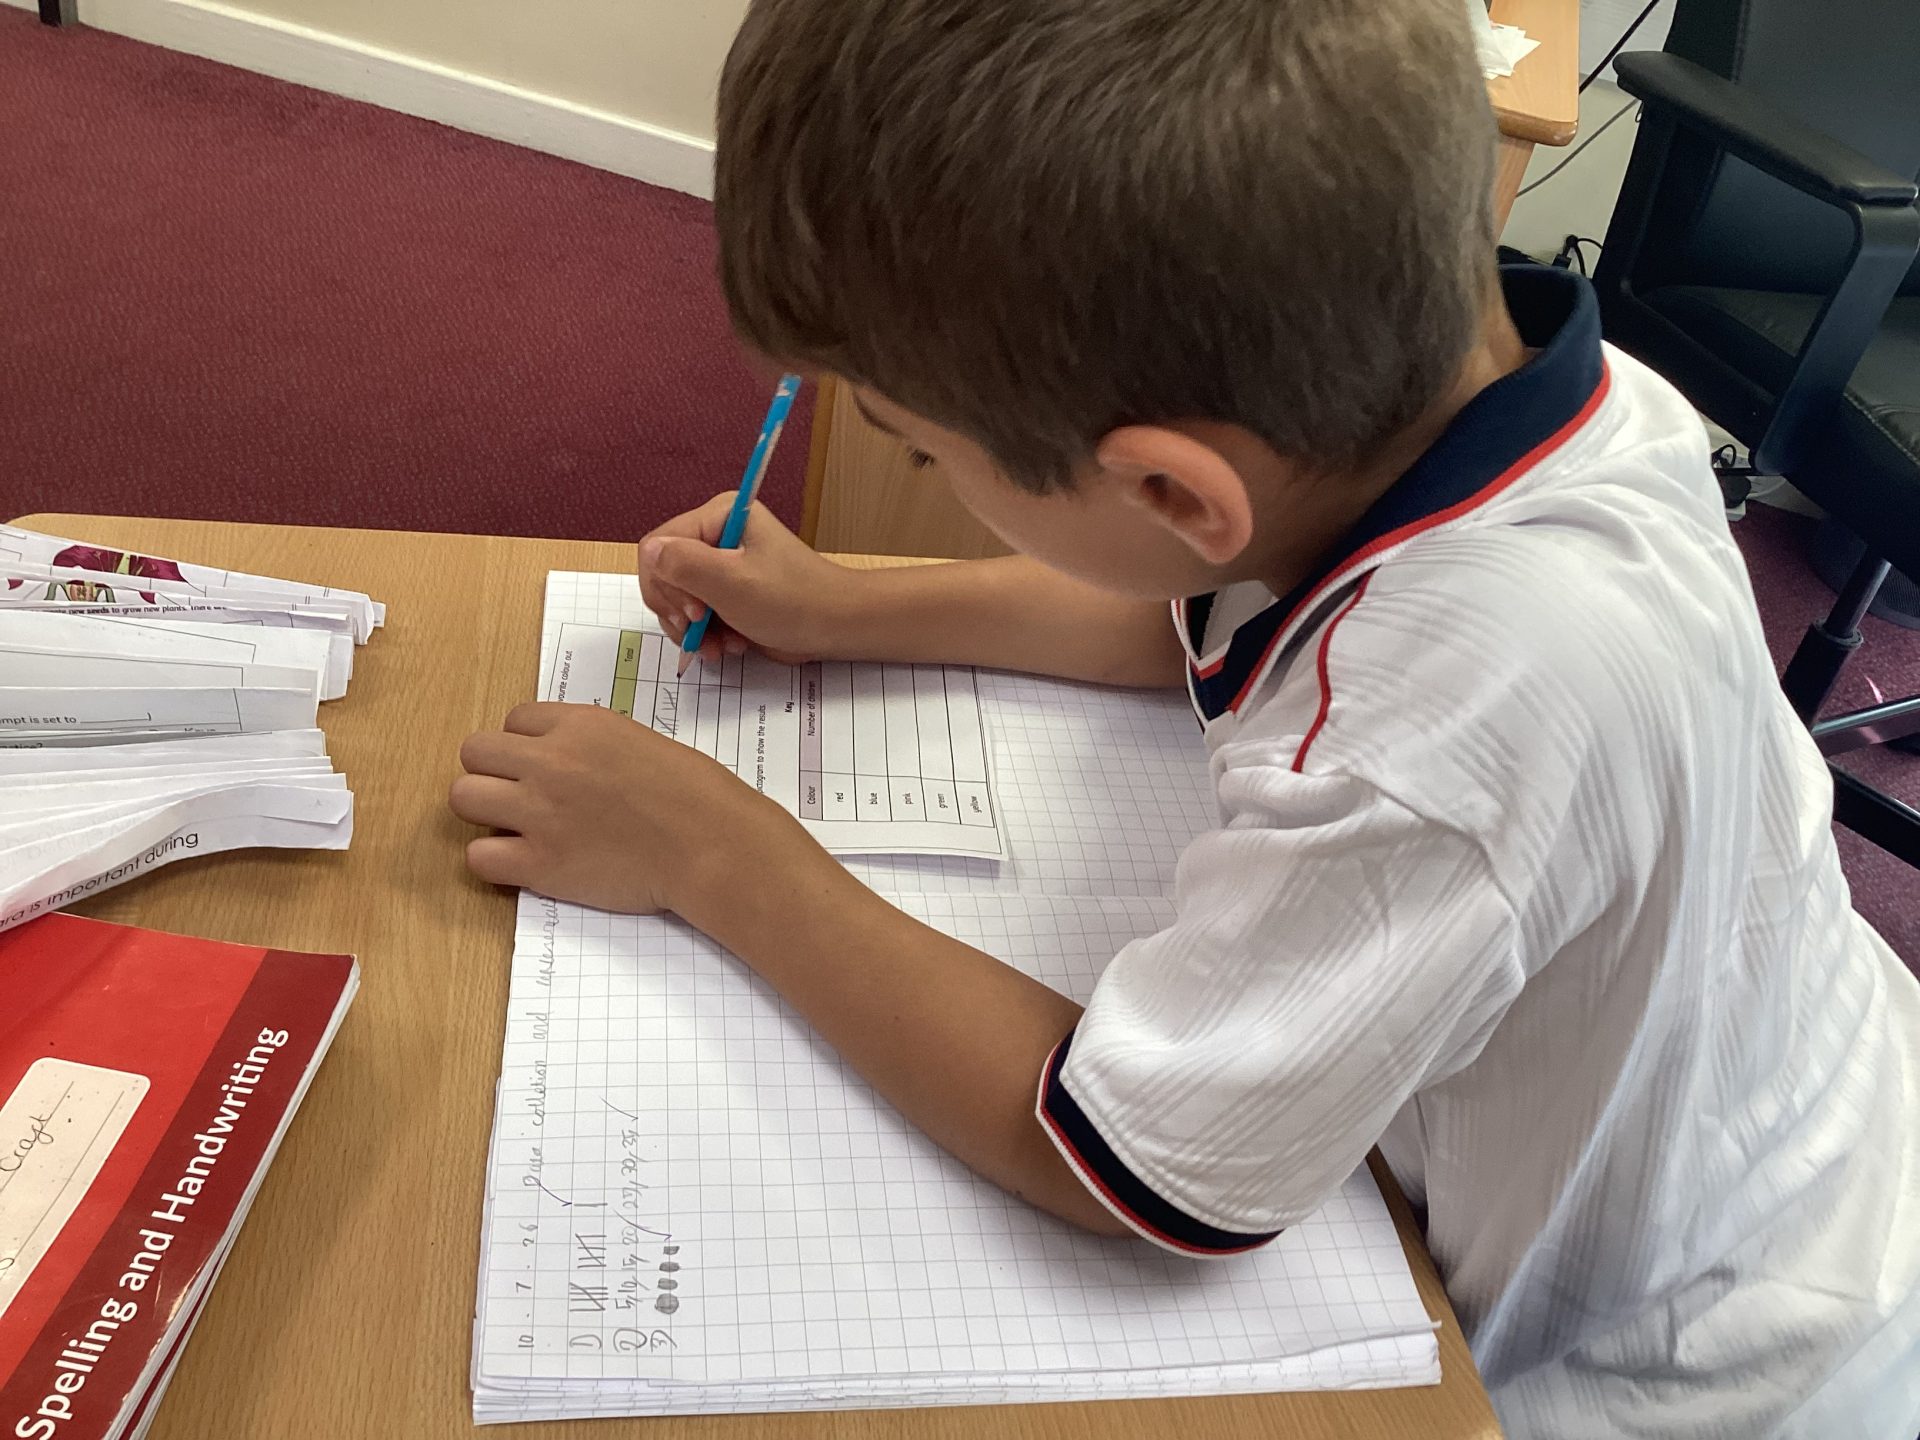
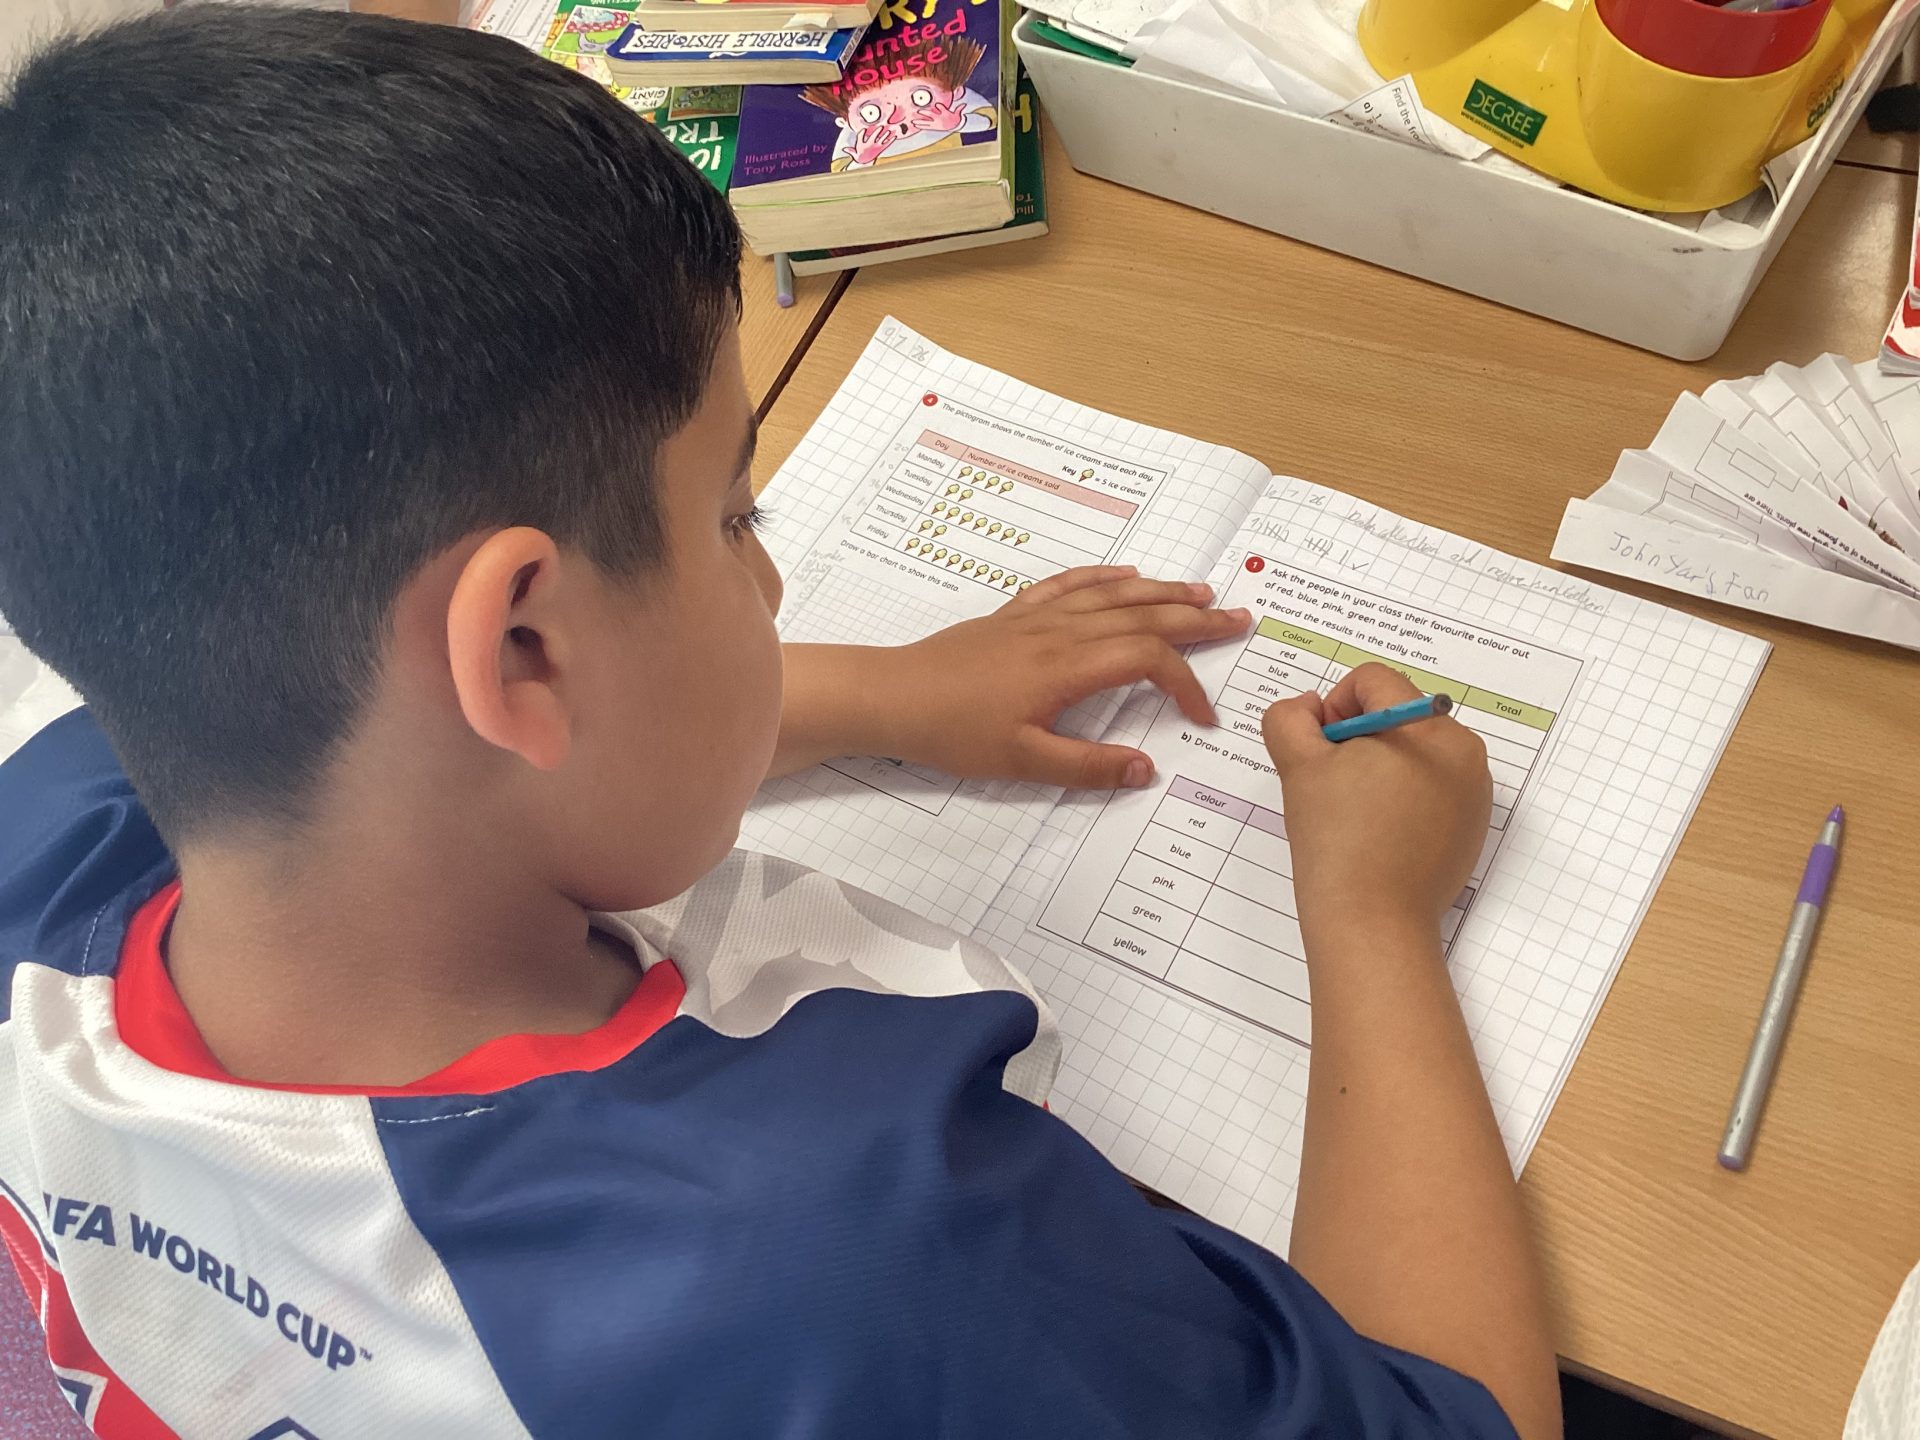
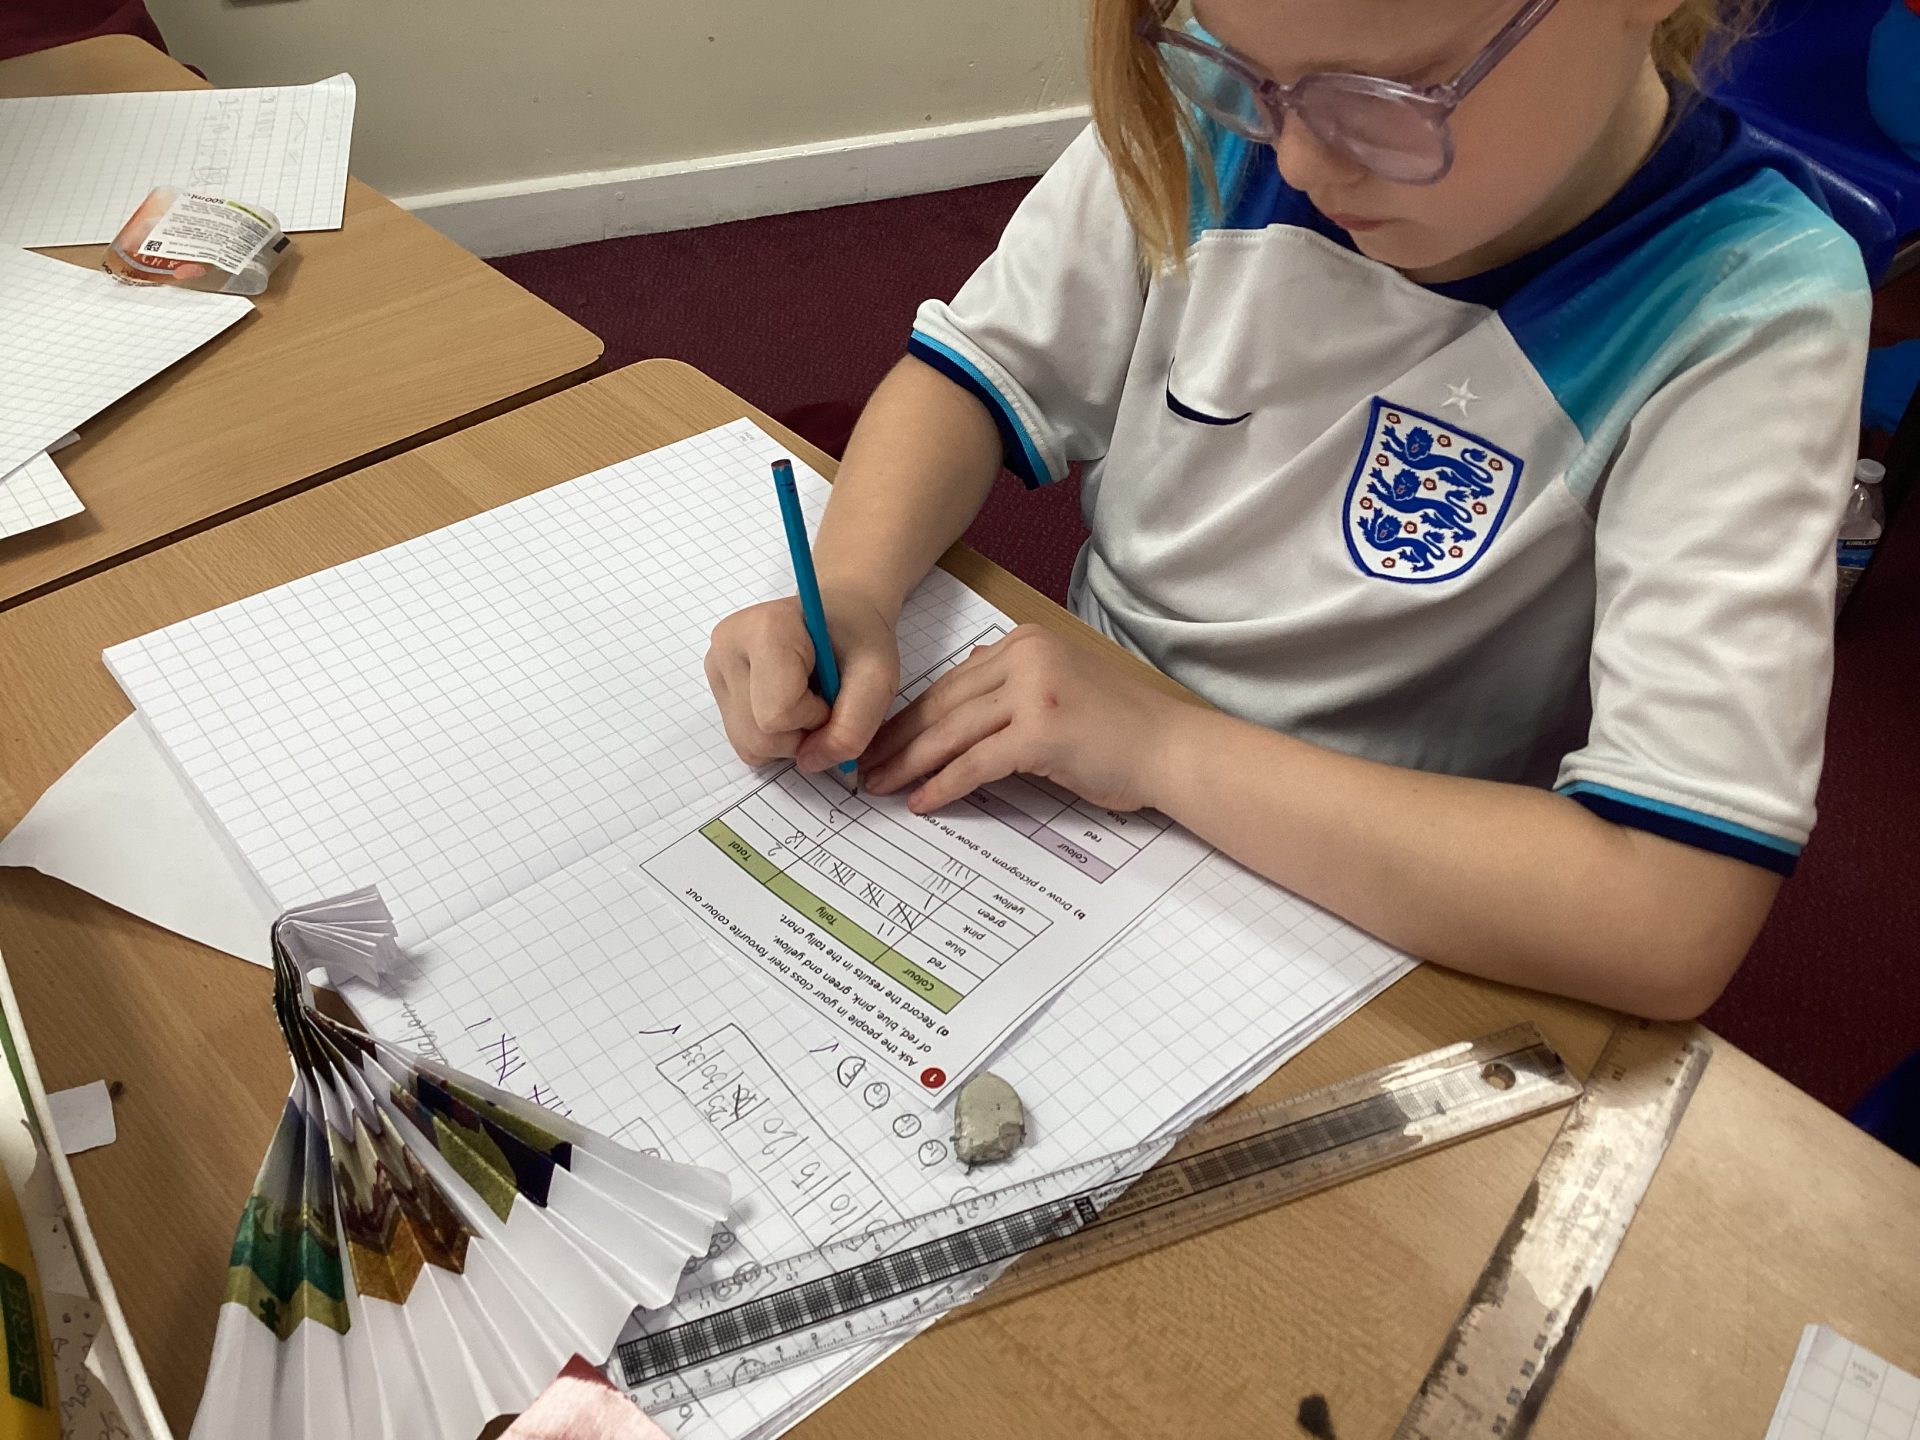
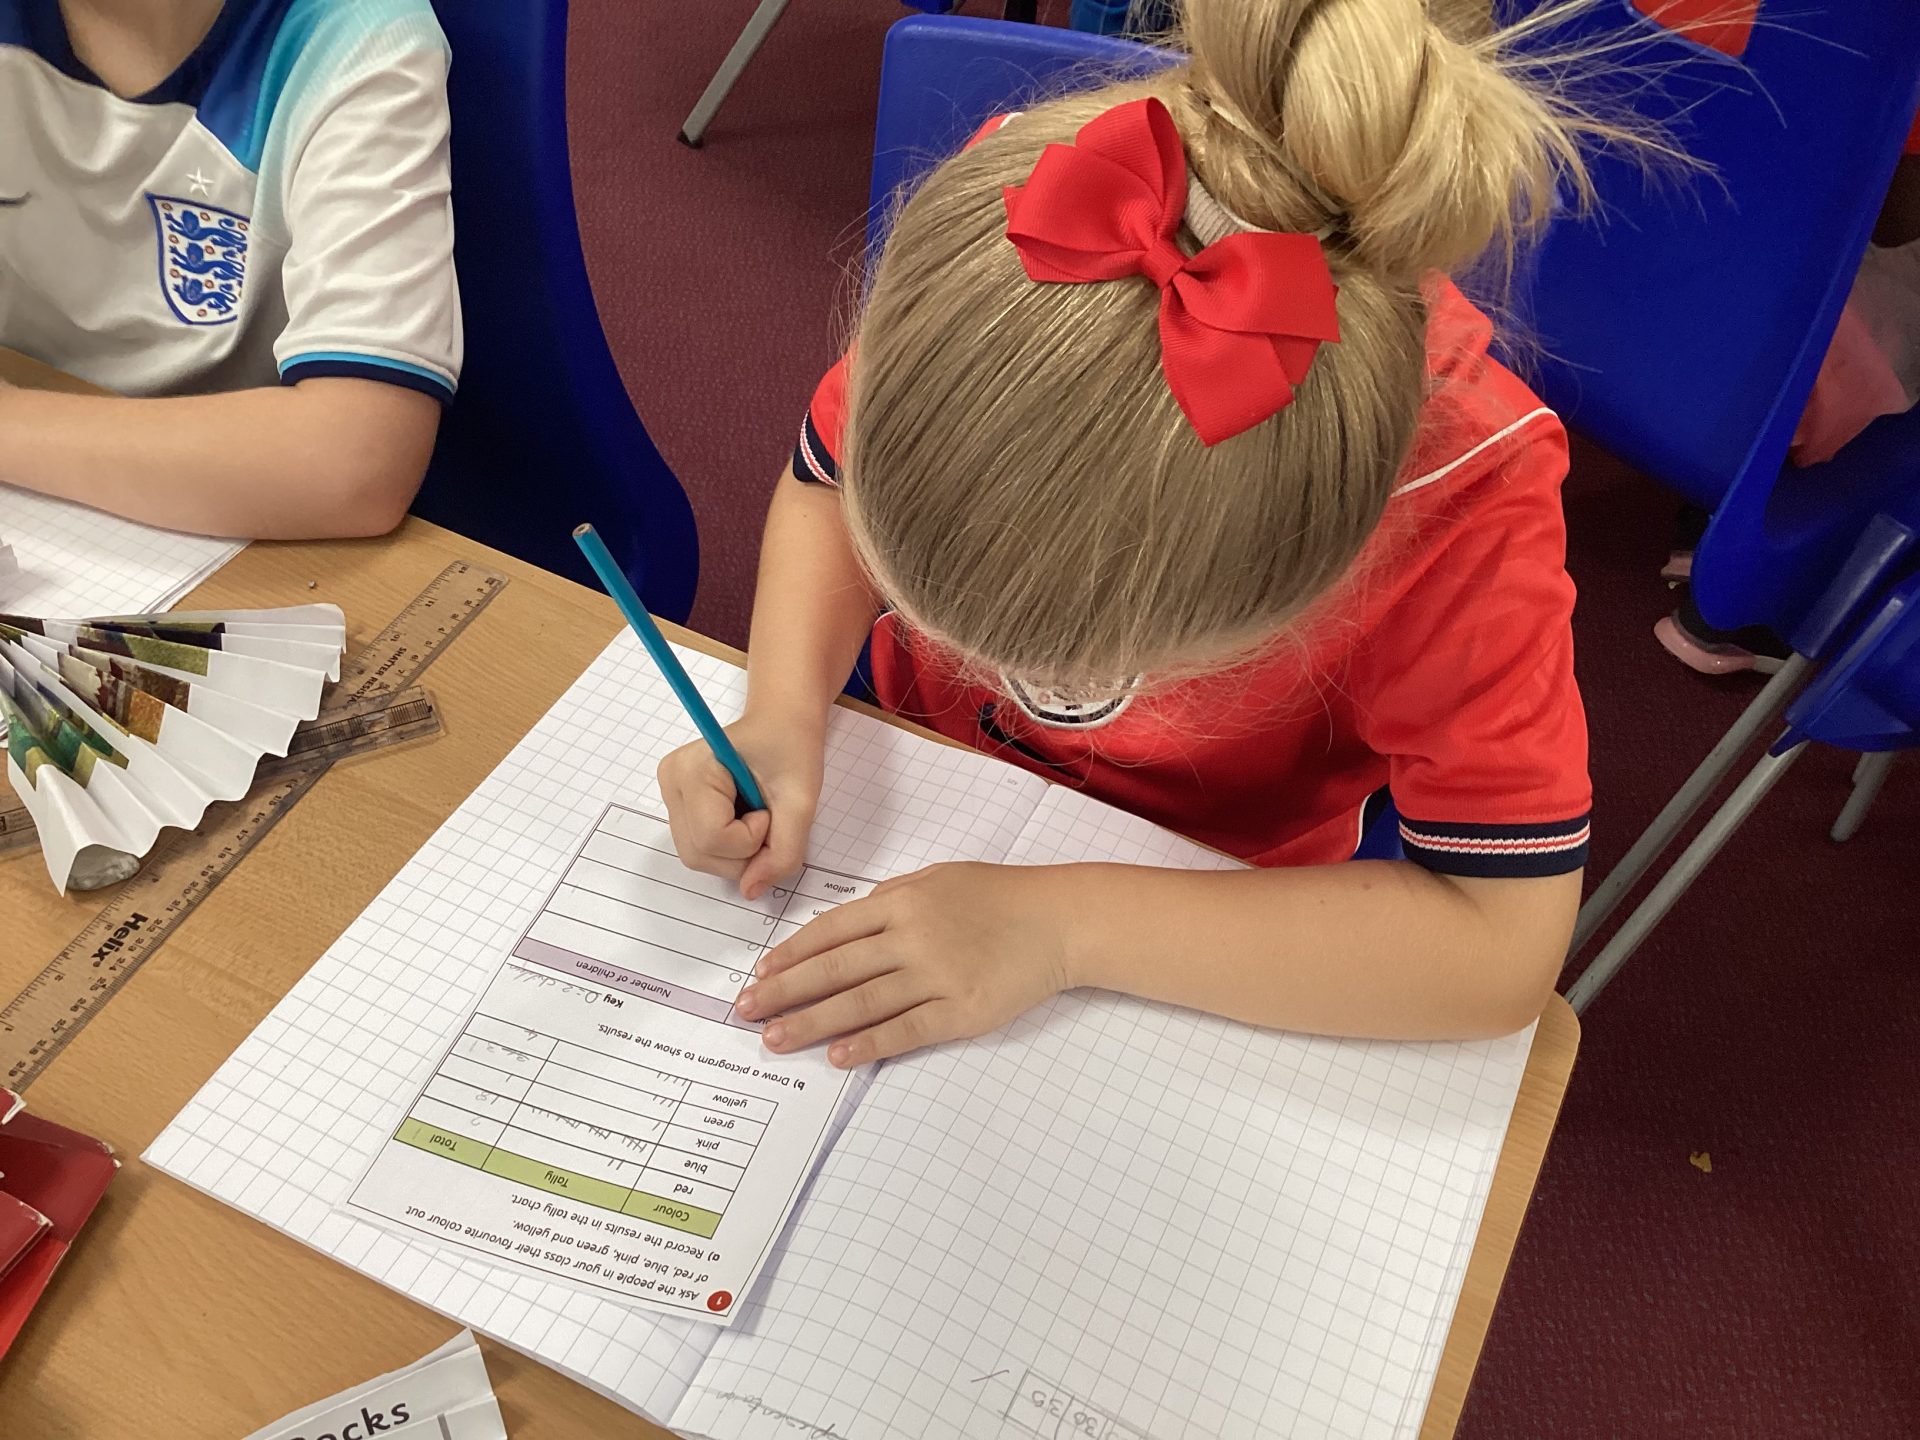
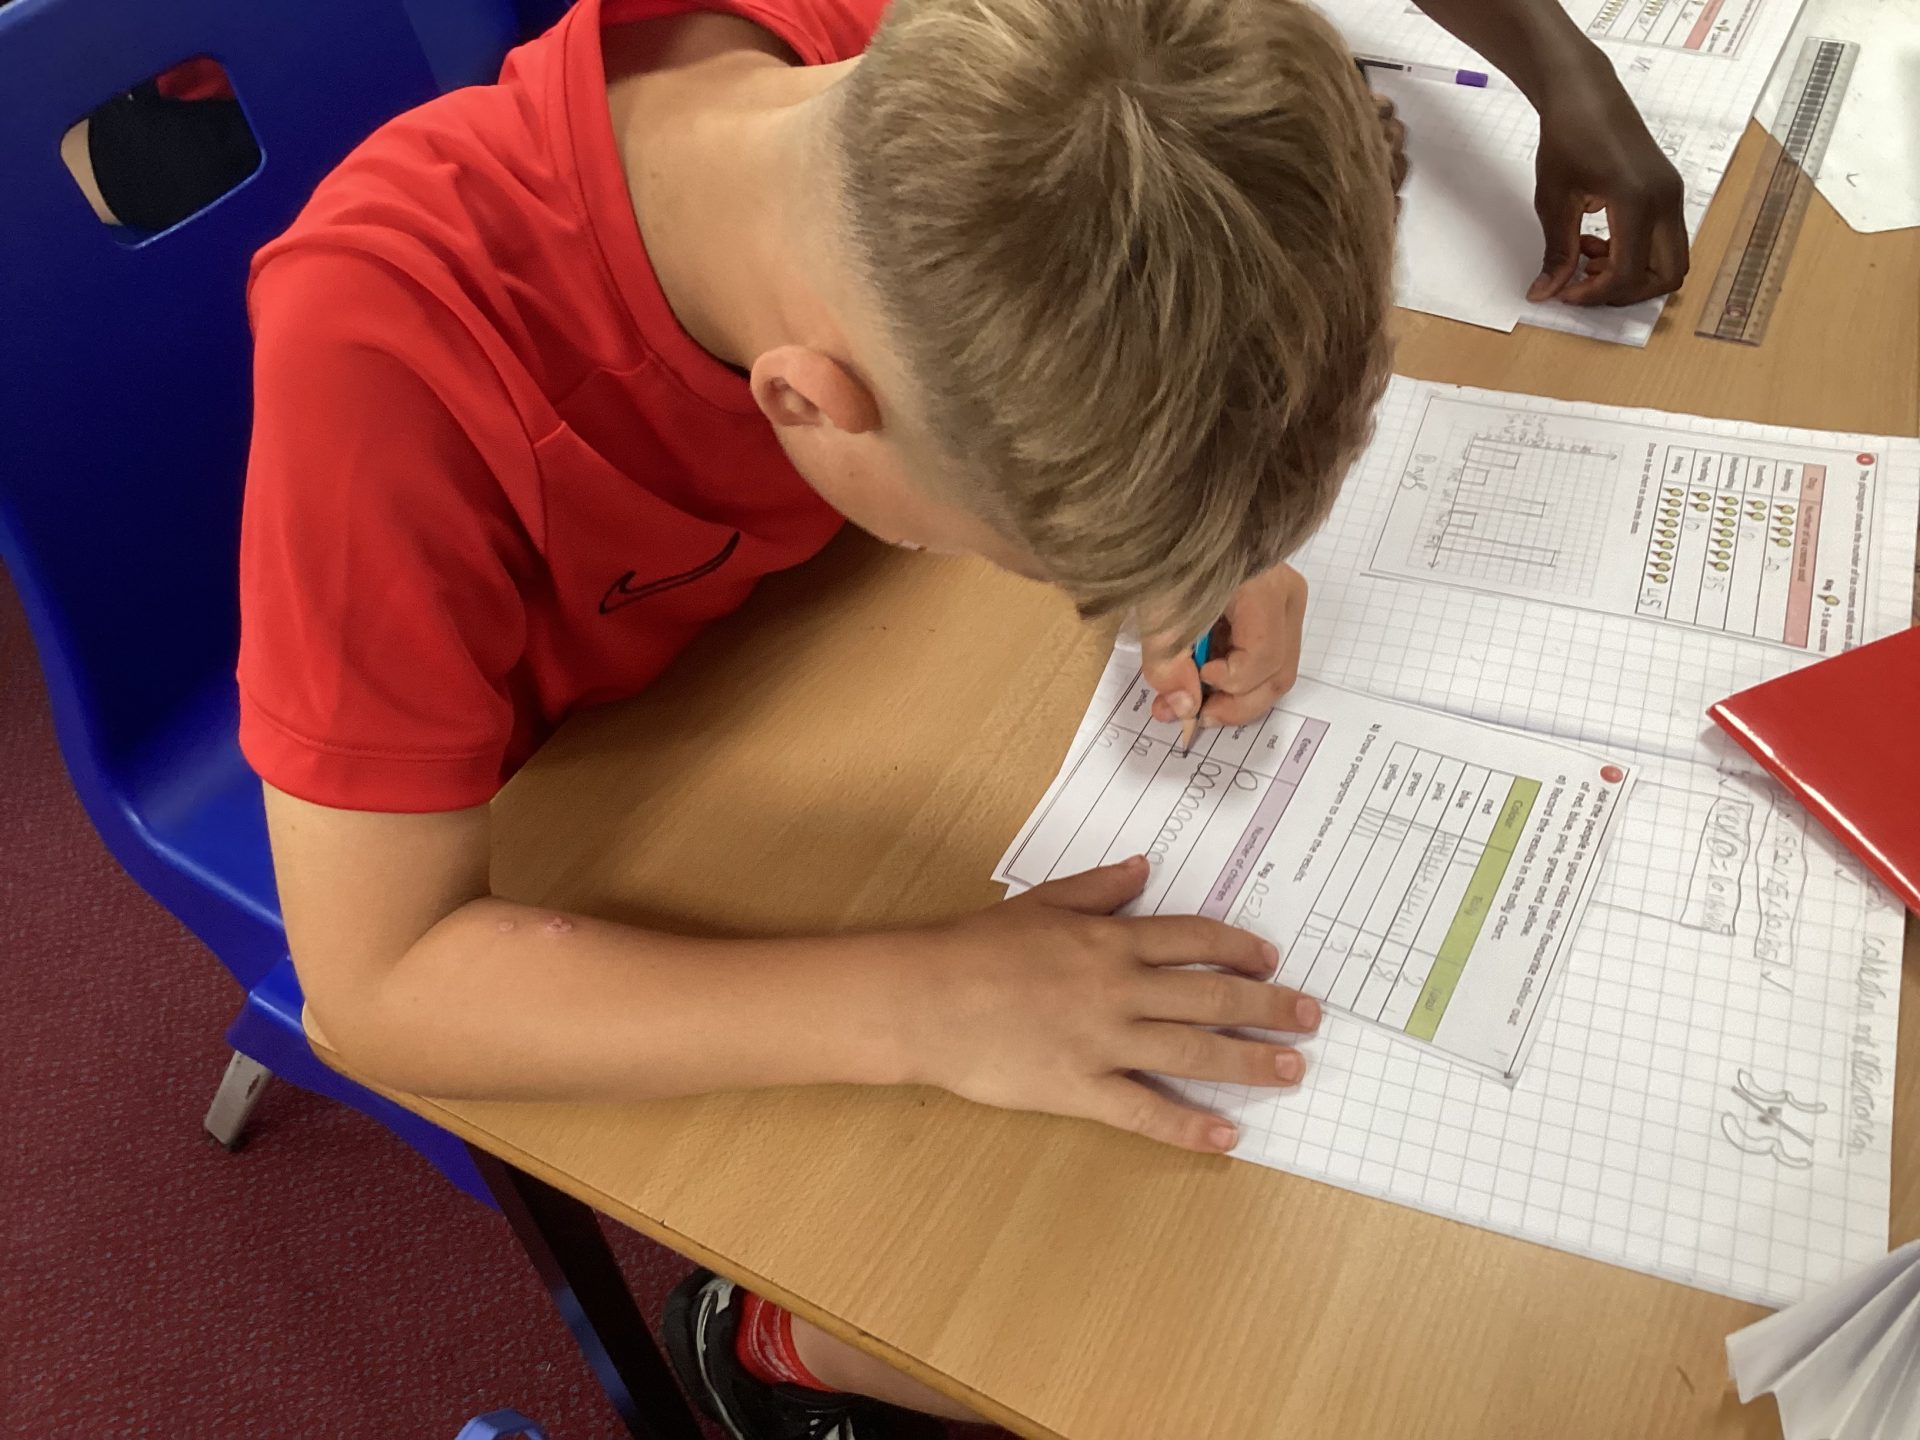
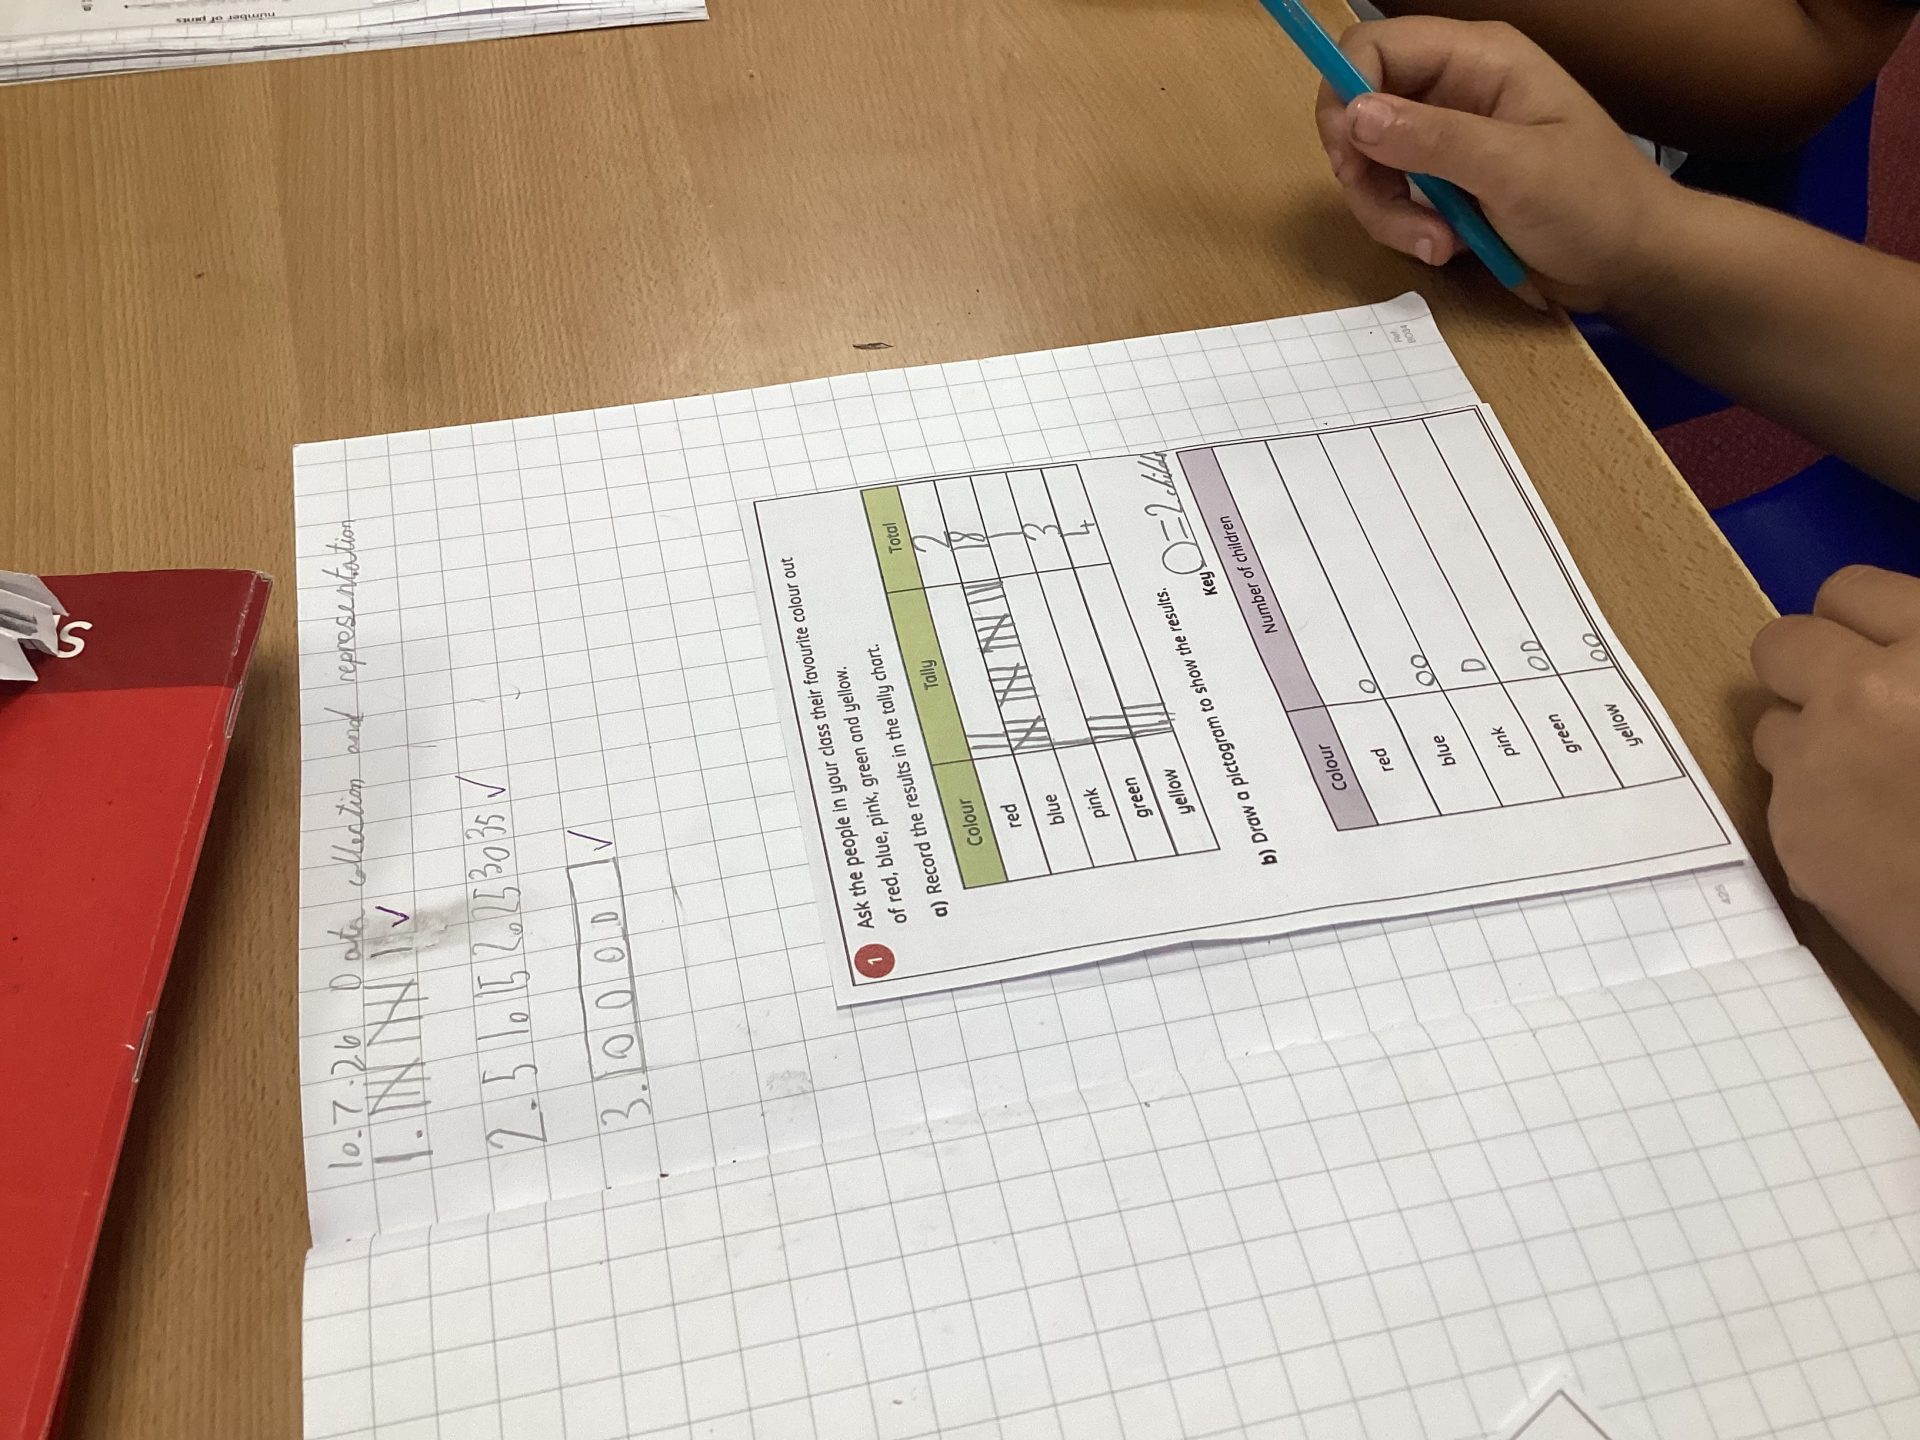
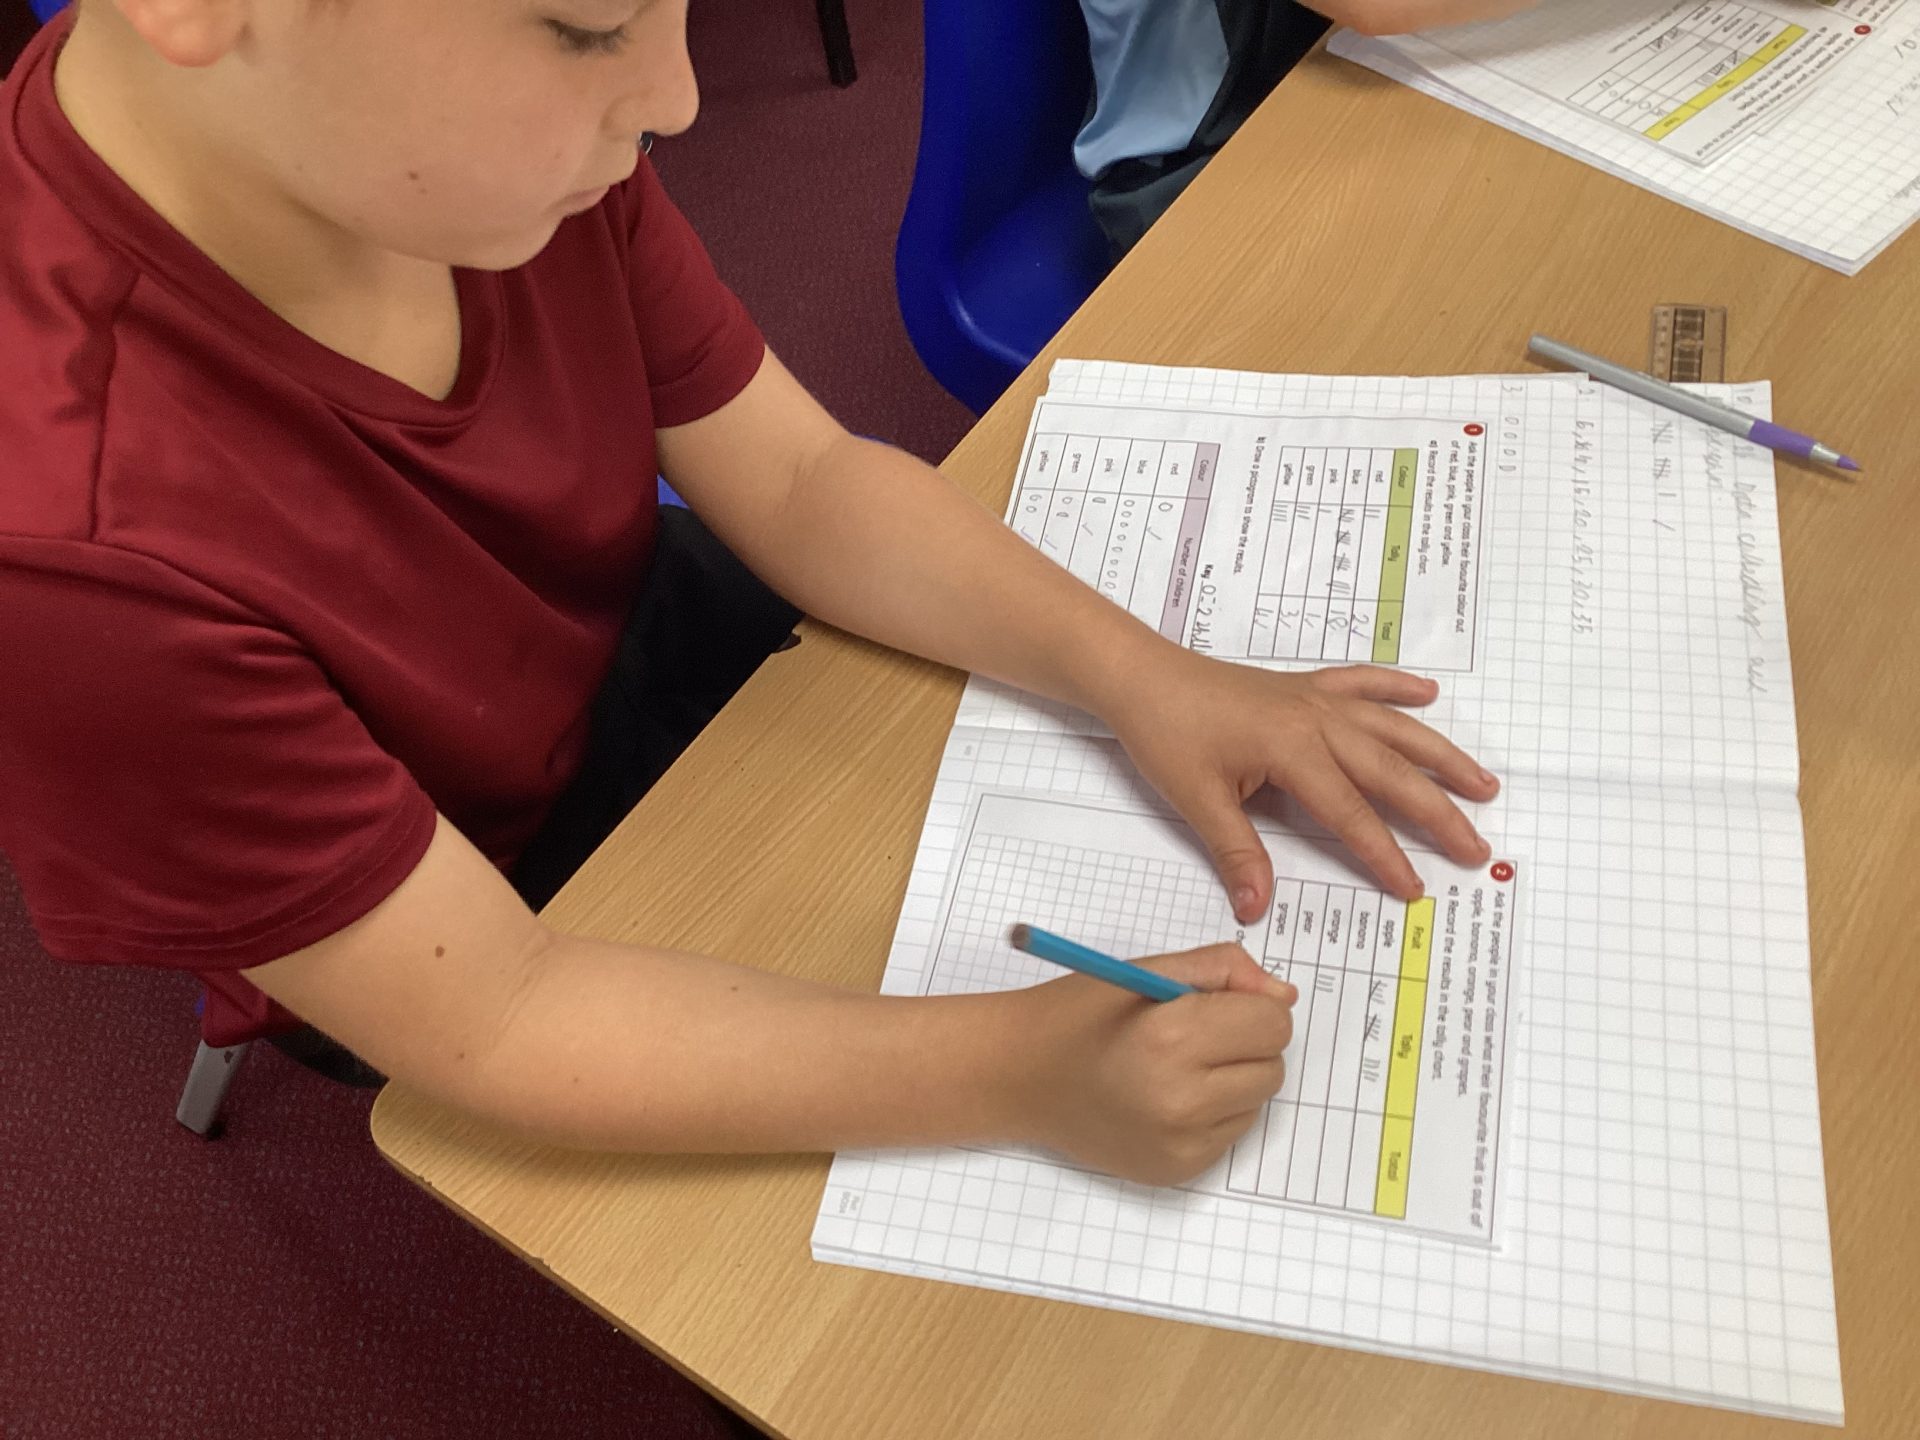
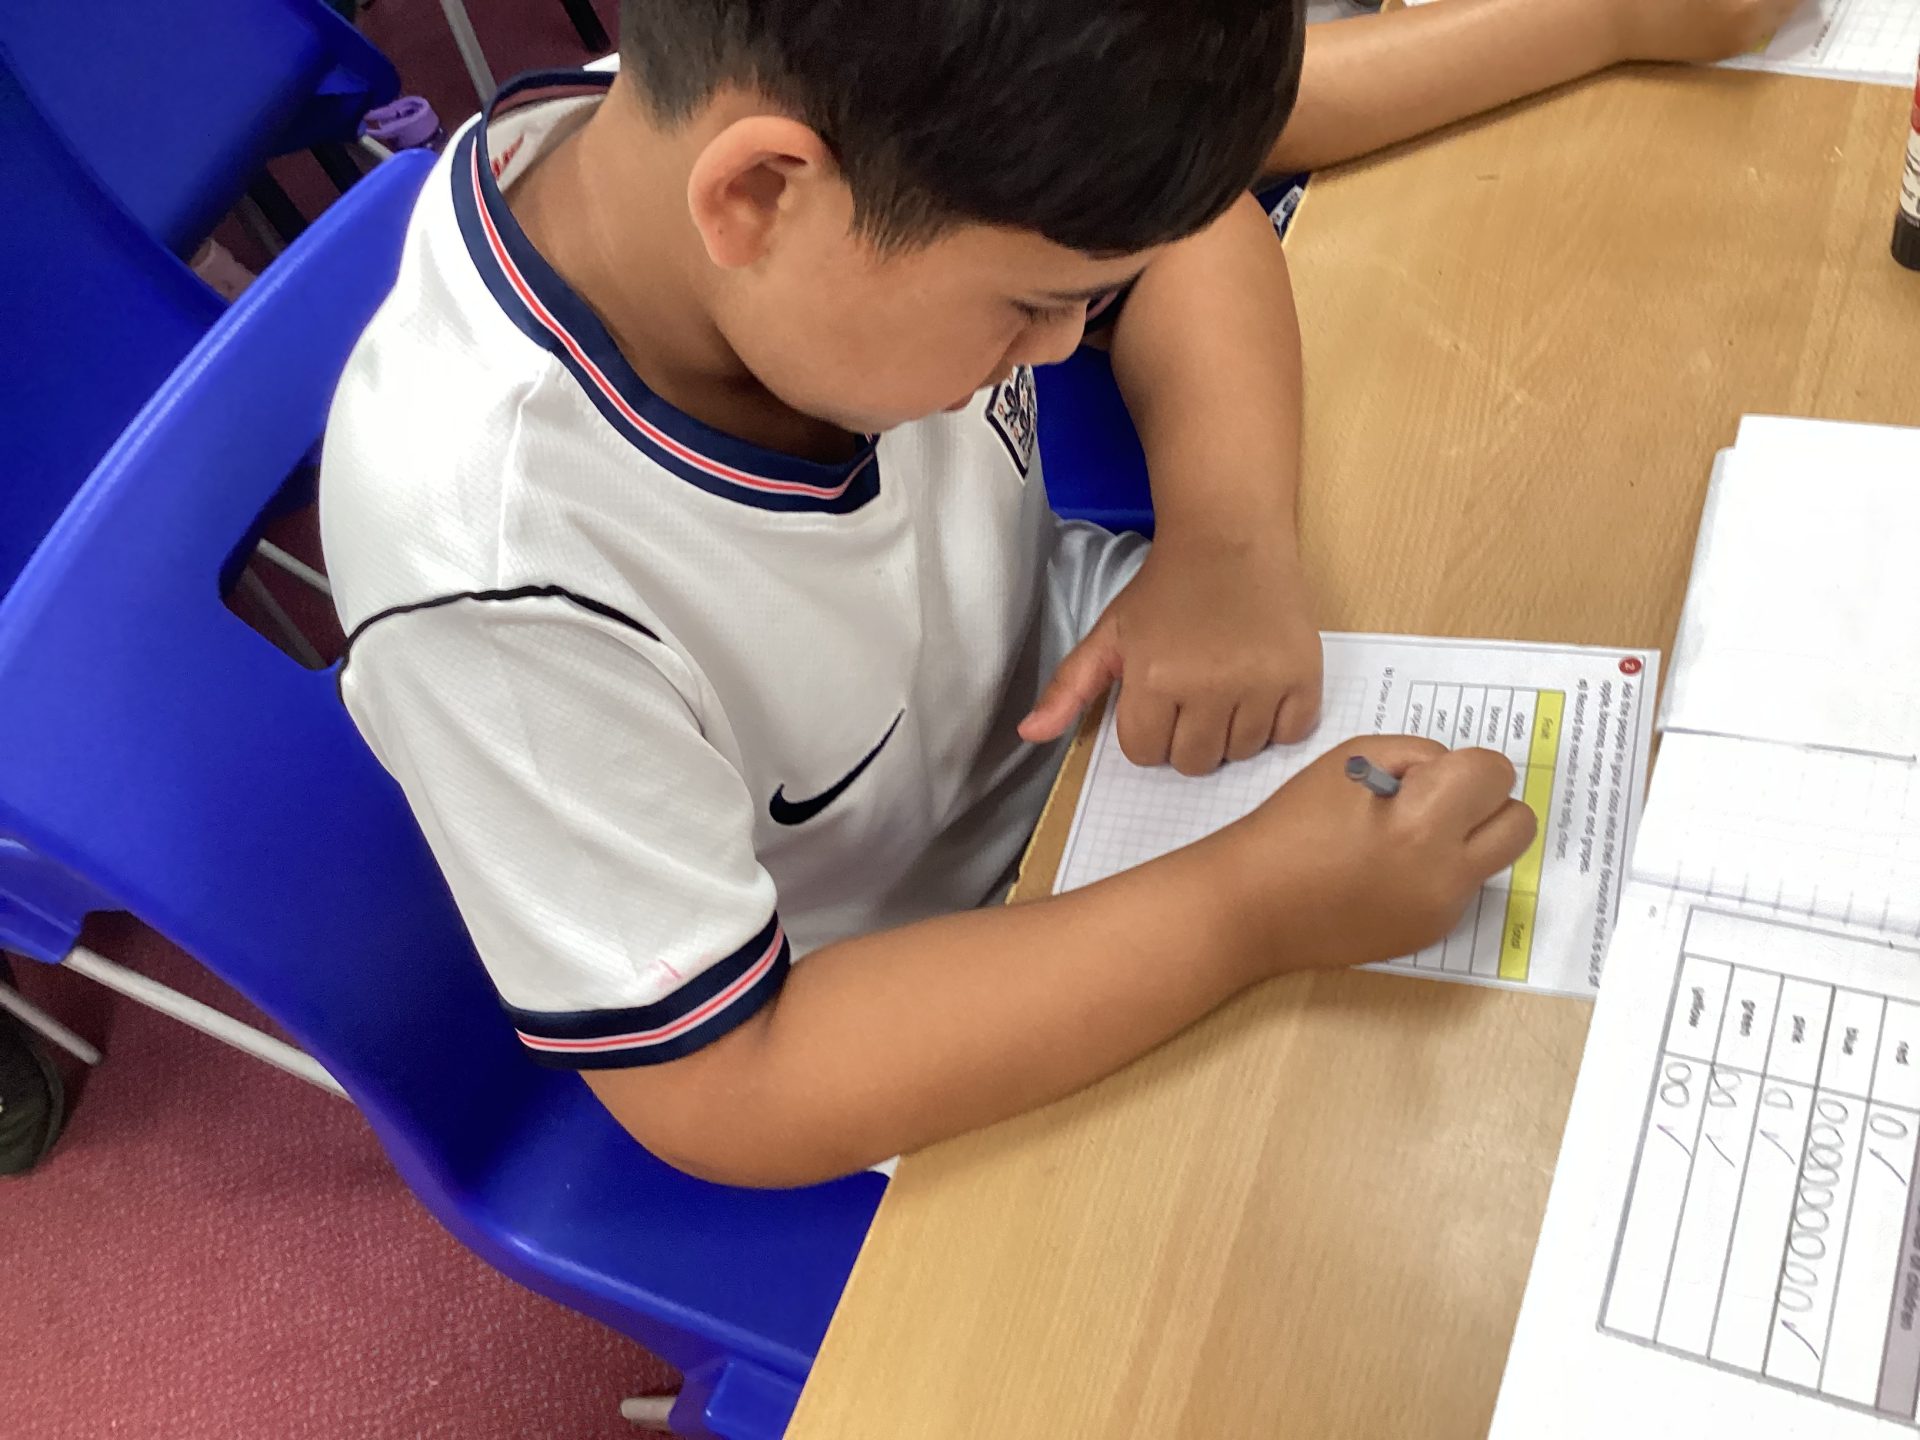
Over the last couple of weeks in Maths, Year 3 have been focusing on different forms of data collection and representation.
Last week we looked at pictograms, interpreting information, before creating our own pictograms. We then interpreted tally charts and bar charts and created our own.
This week, we are learning about two way tables and answering questions in relation to the information given in tables.